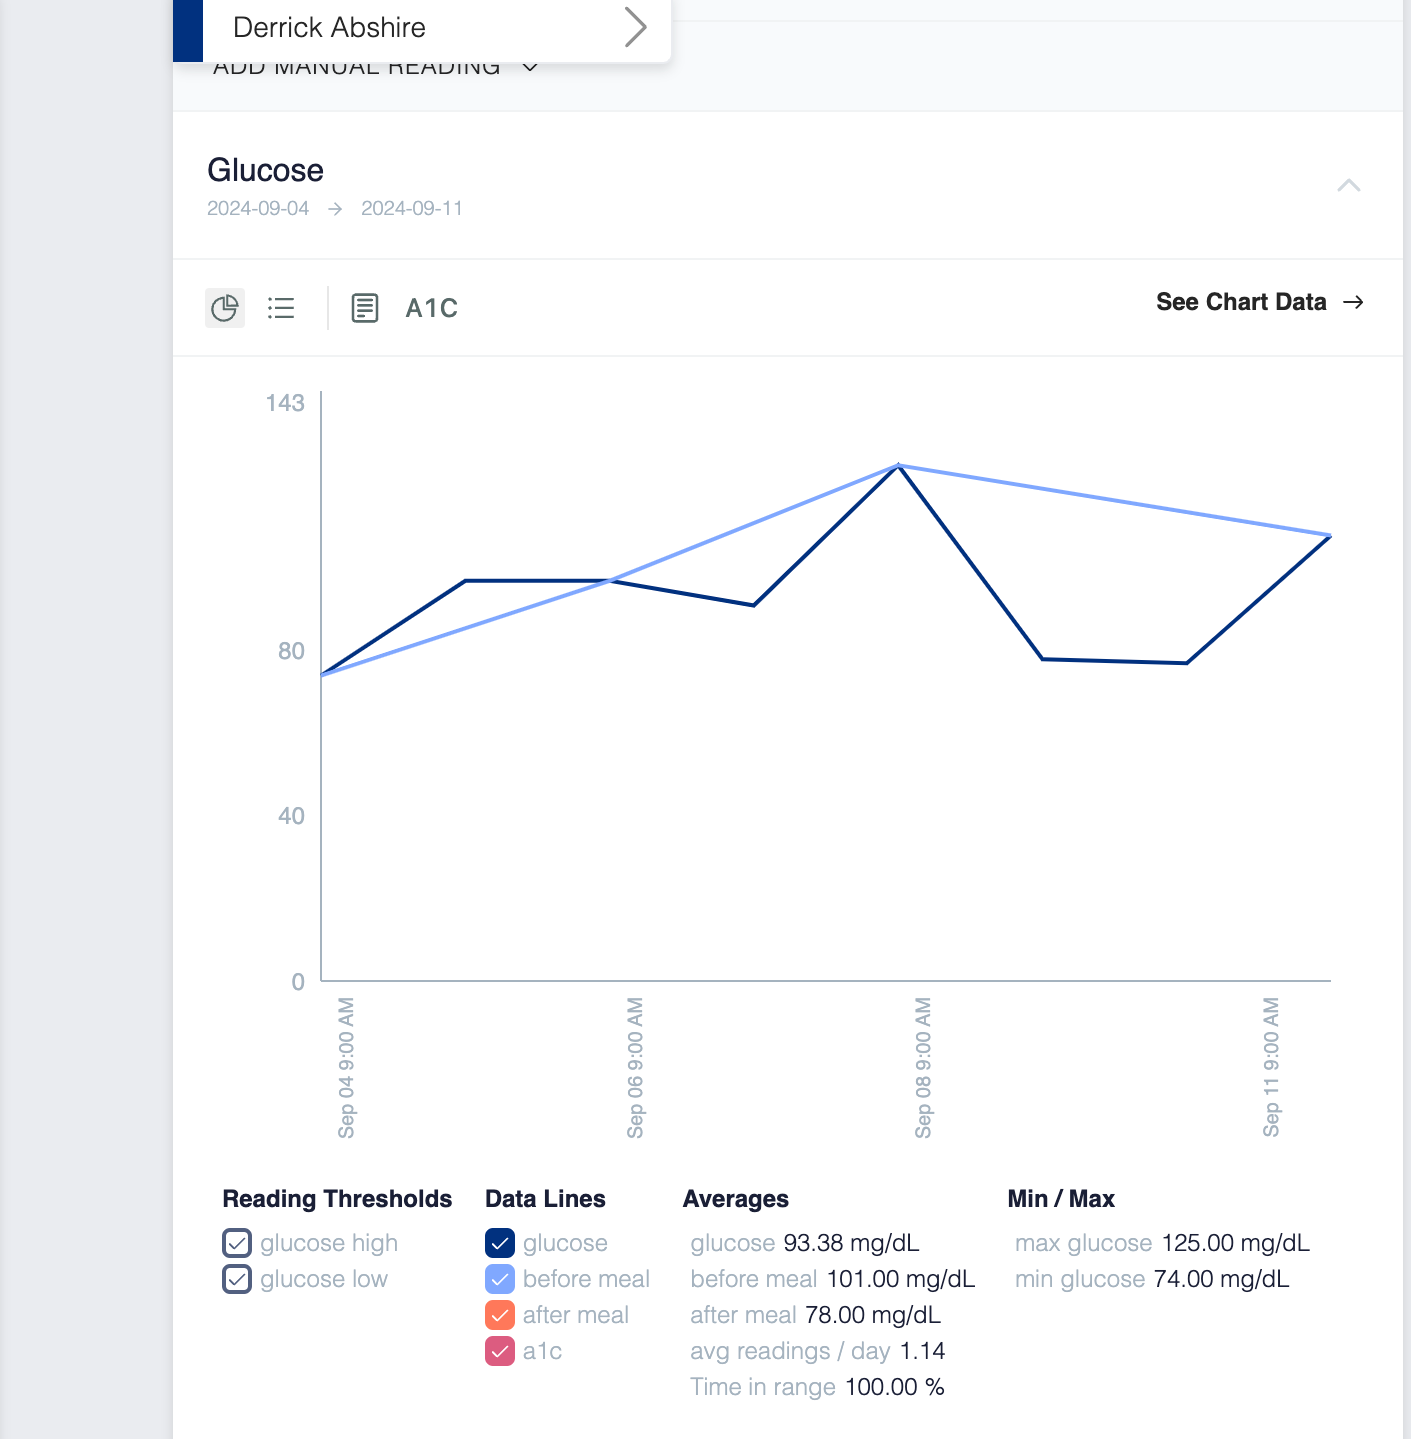
Min / Max on reading charts.
Today we have a quick update on new actionable numbers providers and their teams have at their fingertips on vitals charts.
The quick view charts have always shown patient averages over a specified time period when it comes to vitals such as average systolic blood pressure, average number of readings / day, etc. While averages can be useful they don’t tell the entire story. Now our provider partners and their teams can easily see the minimum and maximum values over a given time period to better understand a patient’s health. This enhancement can be seen for blood pressure, blood glucose, oxygen saturation, weight, and even temperature.
Check it out today and let us know what other information you would like to have at your fingertips.